Open and free

Atlas, the climate change observatory

A 3D globe that brings together the Earth’s vital signs (temperature, polar ice, sea level, air quality, emissions and biodiversity) from scientific and official sources, with the source of every data point.

Layers

What you can see in the Atlas

Each layer brings together data from scientific and official sources. Choose one to see where each data point comes from.
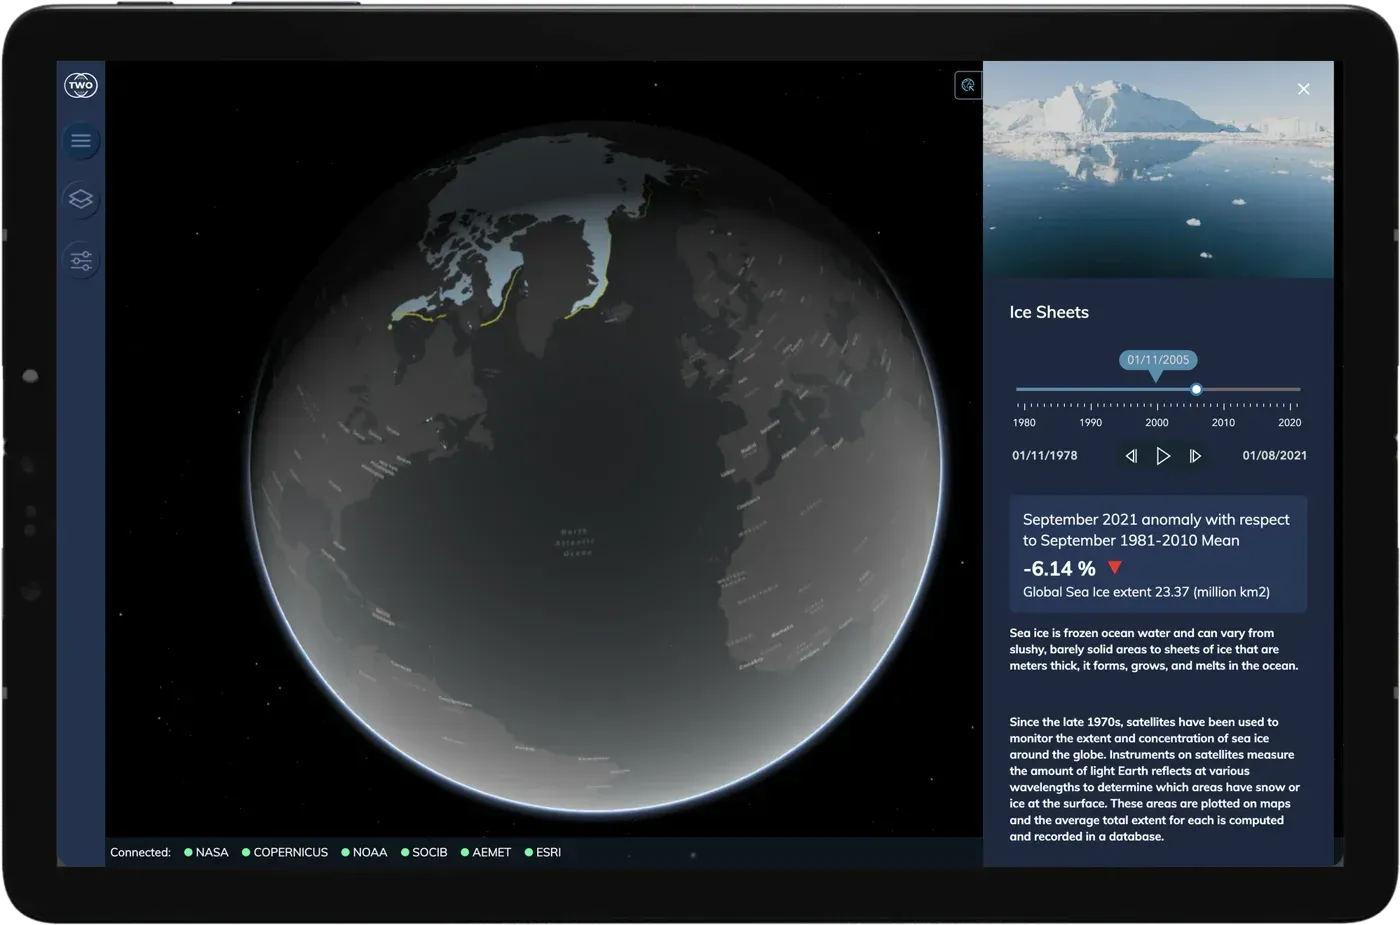
  • Atlas on a tablet showing Arctic sea ice extent and its evolution since 1978

    Ice sheets

    Polar ice, measured by satellite since 1978. Travel through more than forty years month by month, compare it with the historical average and watch it retreat.

    • NSIDC
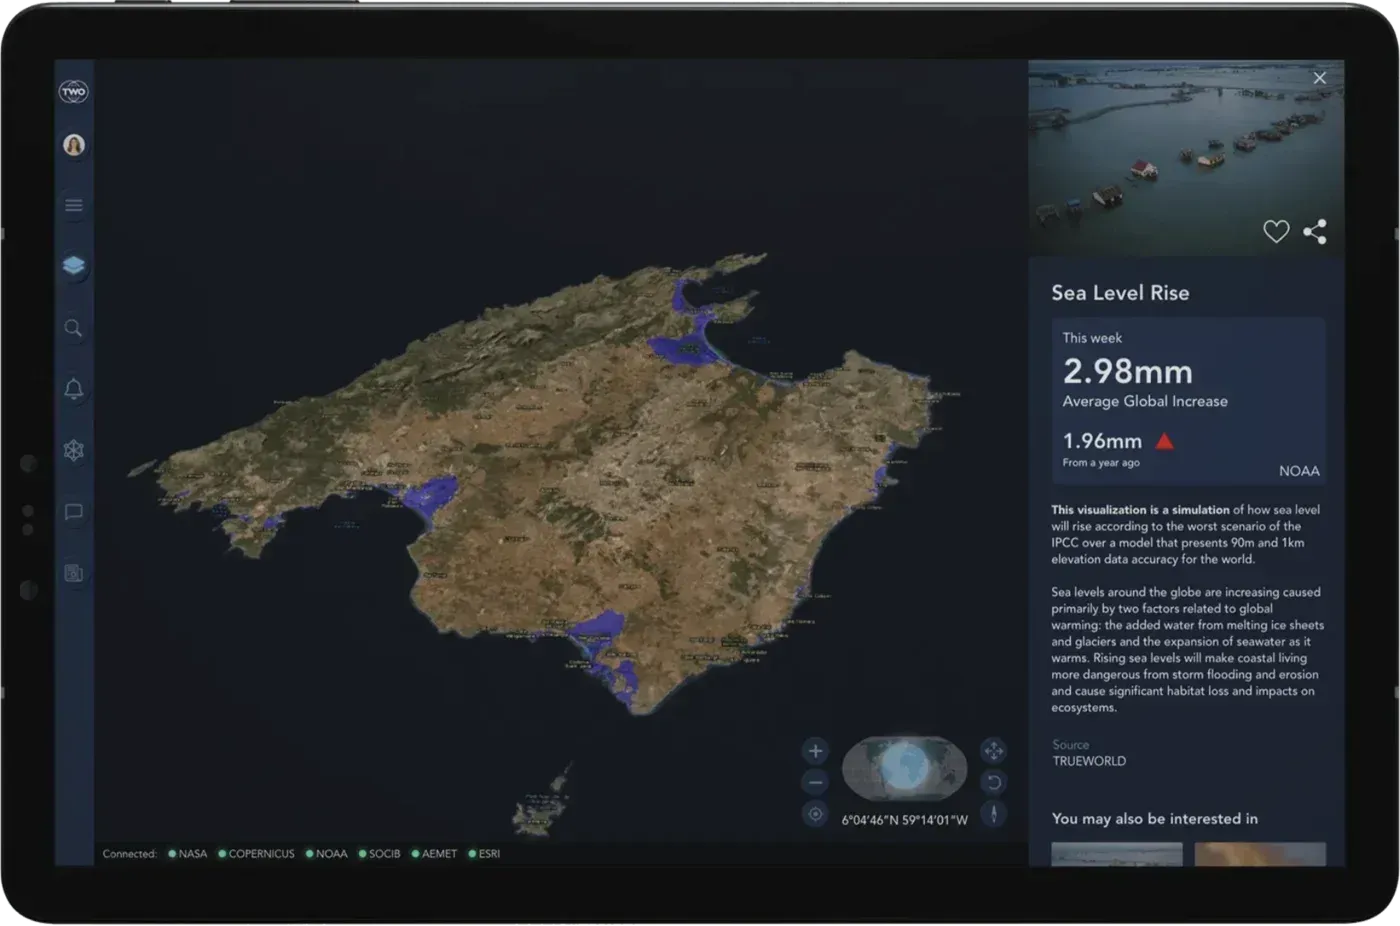
  • Atlas on a tablet showing a sea level rise simulation for Mallorca

    Sea level rise

    Which parts of the coast would end up under water according to IPCC scenarios. Zoom in on your beach, your port or your city and see for yourself.

    • NOAA
    • IPCC
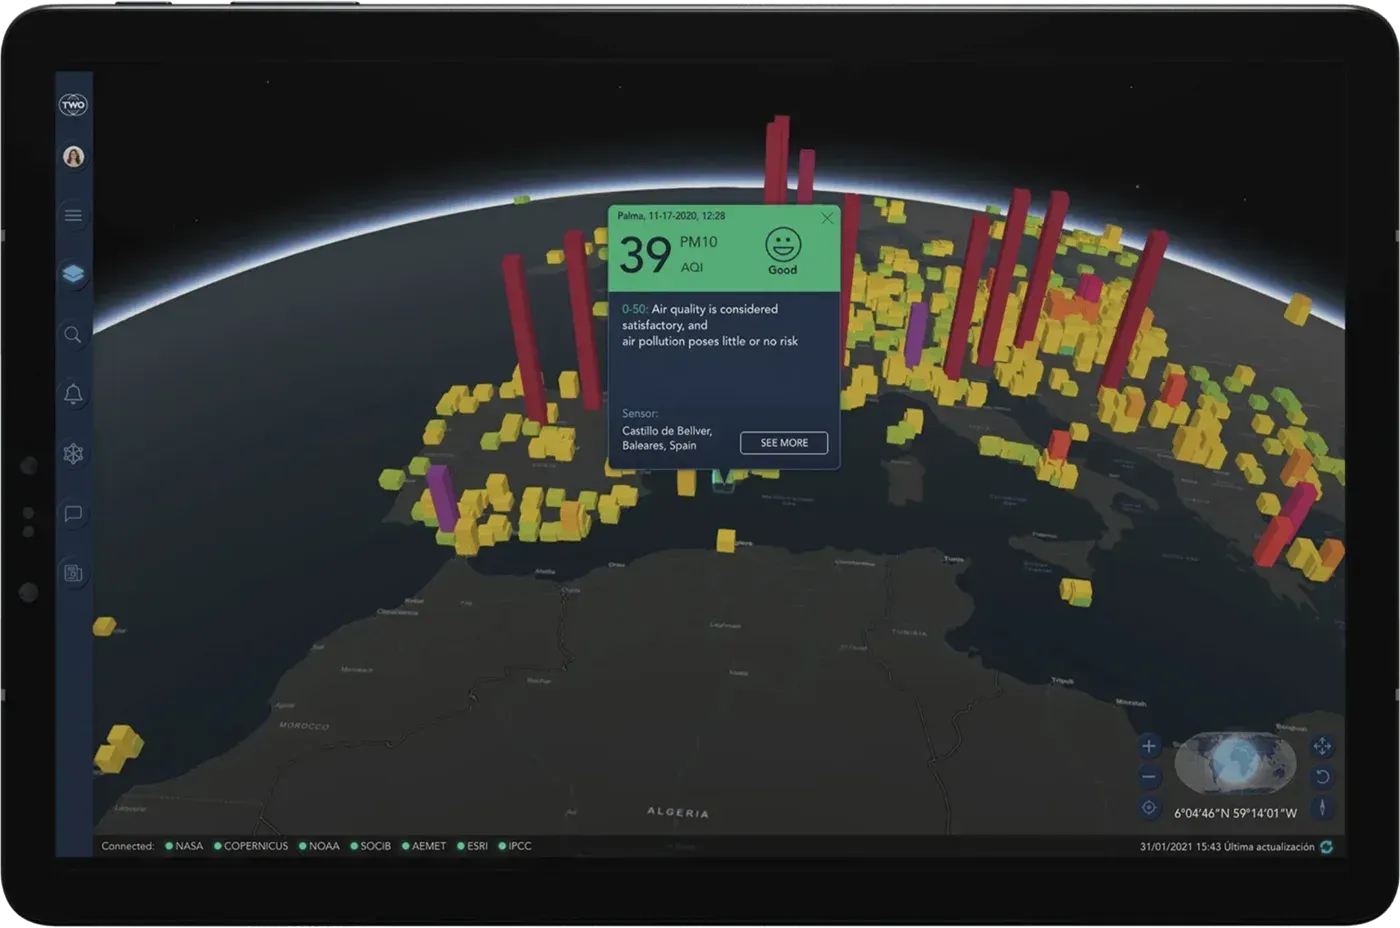
  • Atlas on a tablet showing air quality across Europe and the Mediterranean

    Air quality

    What you breathe, in near real time. Thousands of monitoring stations worldwide, each with its air quality index and the pollutant that weighs most at that spot.

    • WAQI
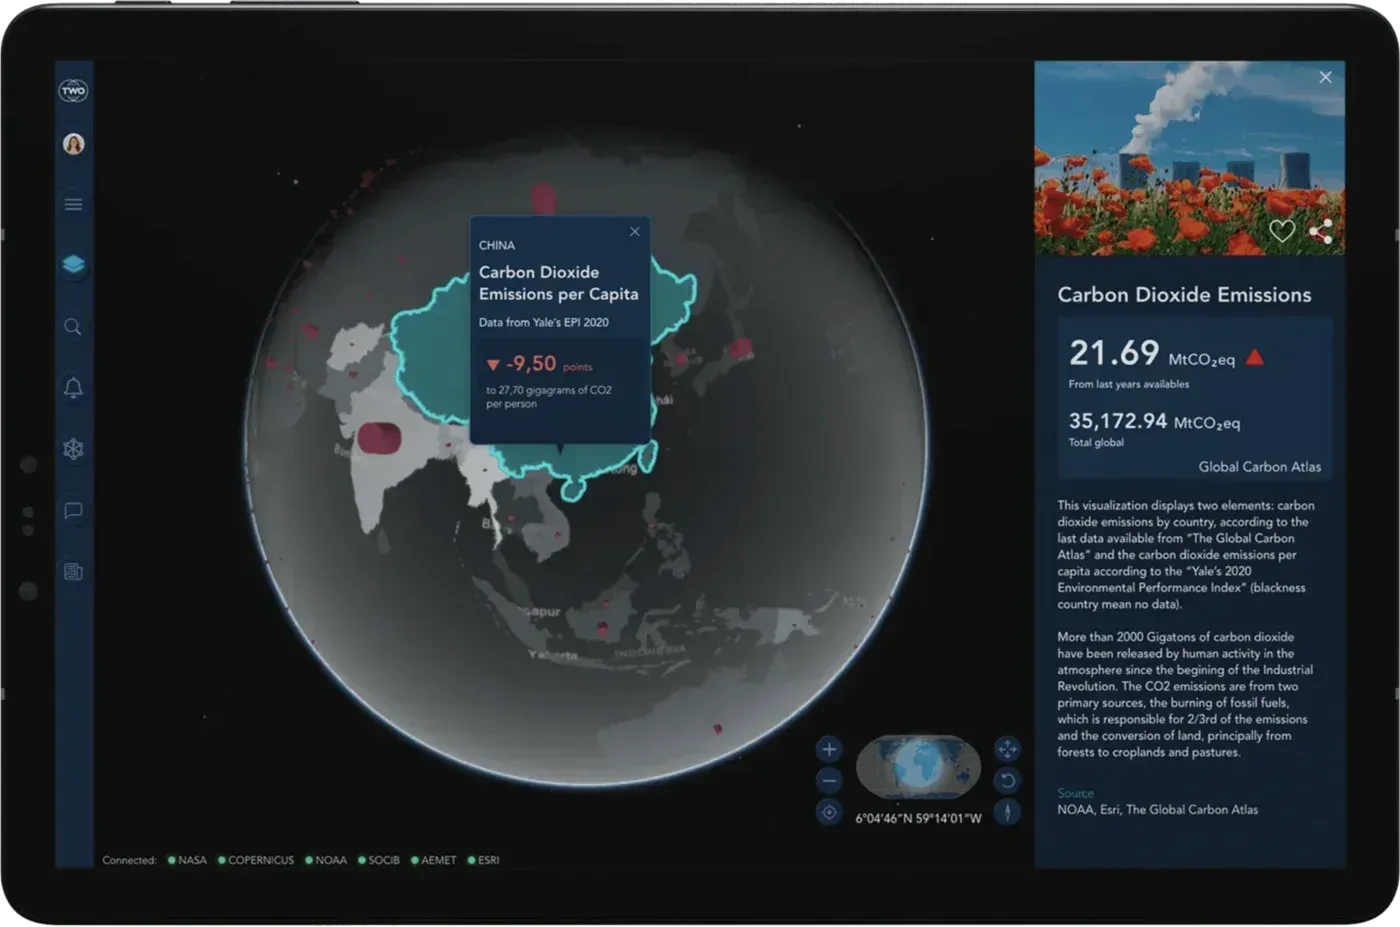
  • Atlas on a tablet showing CO₂ emissions by country in Asia

    Carbon dioxide emissions

    Who emits, and how much. Each country’s carbon dioxide emissions, in total and per person, to see how climate responsibility is really shared.

    • Global Carbon Atlas
    • Yale EPI
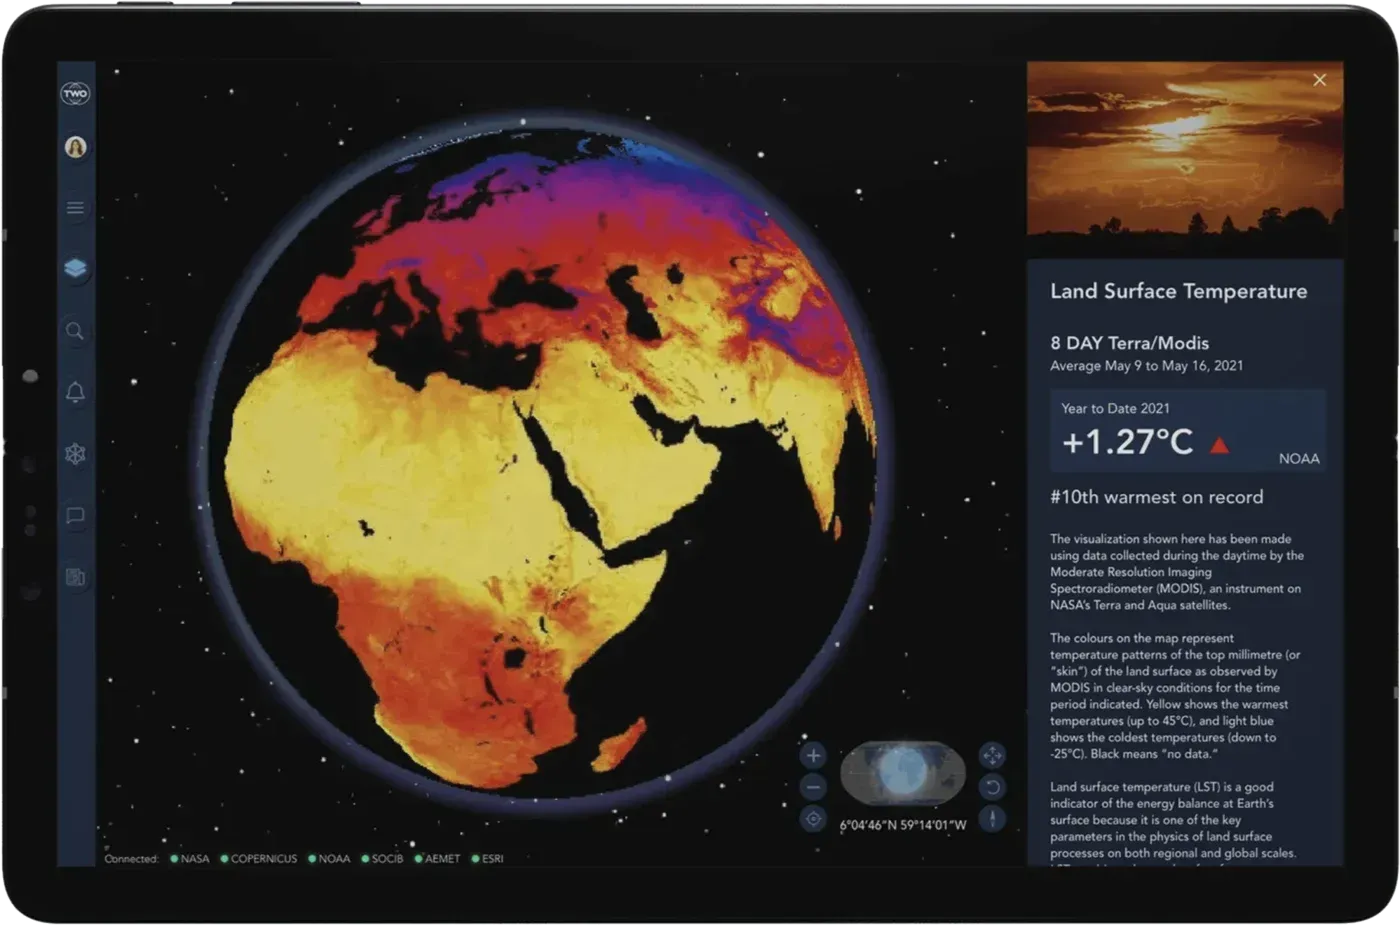
  • Atlas on a tablet showing the land surface temperature layer

    Land surface temperature

    The planet’s skin, seen by satellite. Ground temperature measured from space, where heatwaves and the hottest areas take shape.

    • NASA (MODIS)
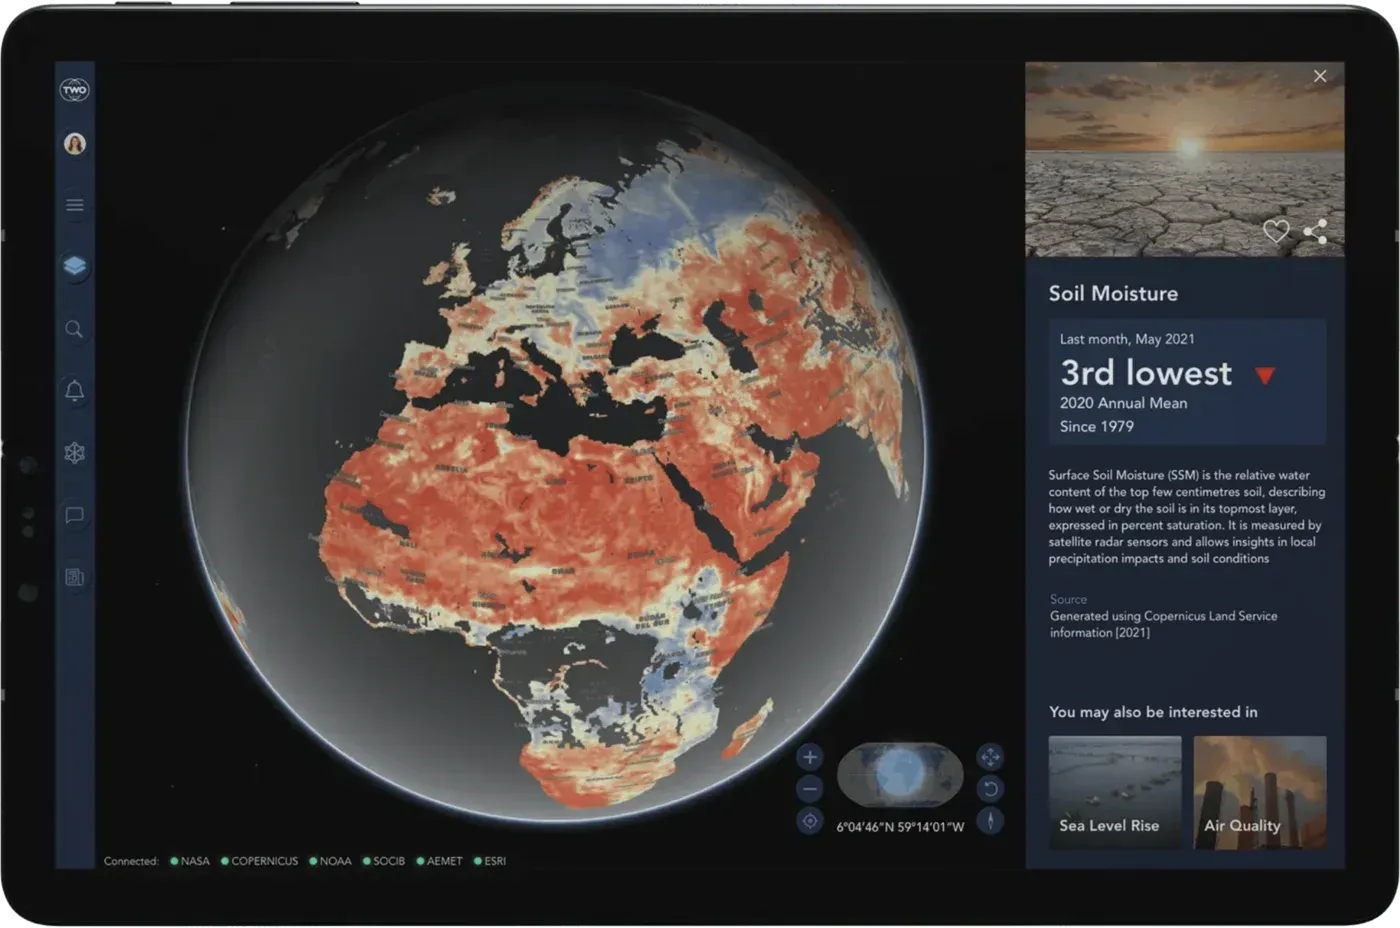
  • Atlas on a tablet showing soil moisture across Europe and Africa

    Soil moisture

    The water the land holds. A key indicator to track drought, anticipate fire risk and understand the condition of crops and forests.

    • Copernicus
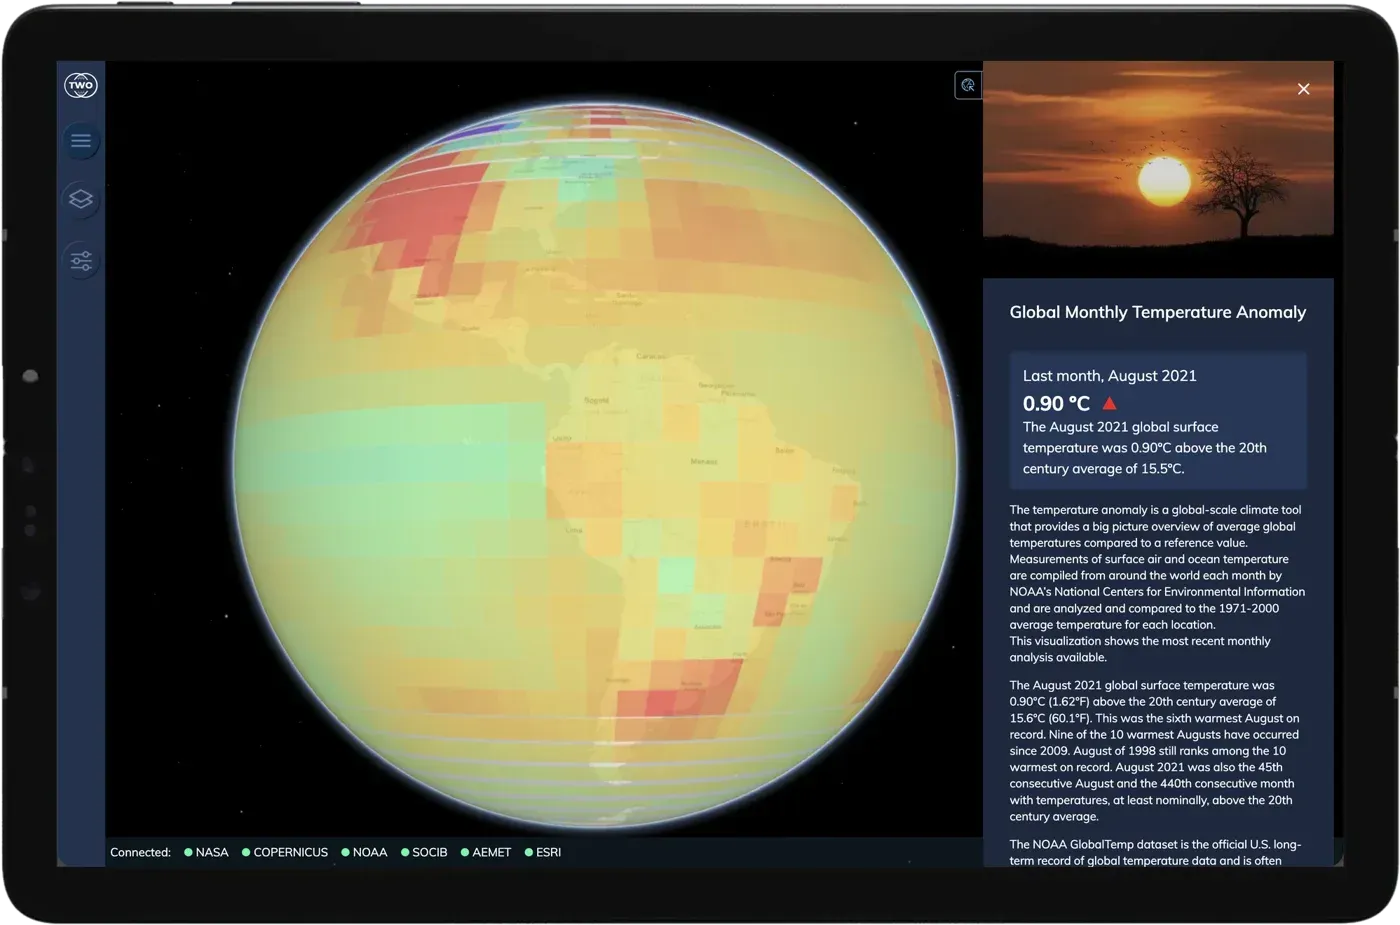
  • Atlas on a tablet showing the global monthly temperature anomaly over the Americas

    Global monthly temperature anomaly

    How much warmer each month is than the historical average. The clearest way to see that warming isn’t a feeling: it’s a trend.

    • NOAA (GlobalTemp)
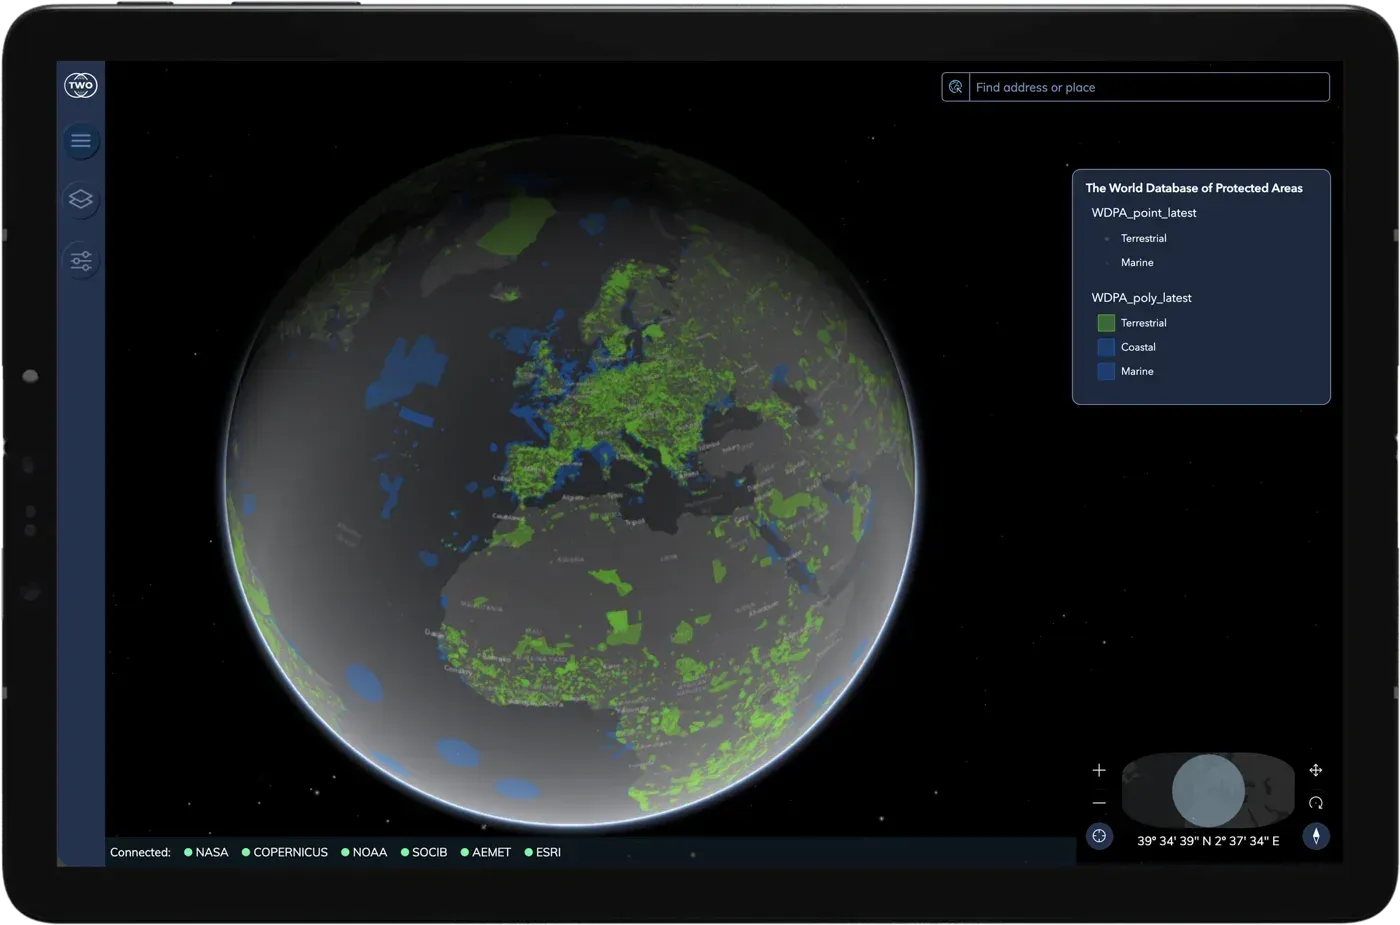
  • Atlas on a tablet showing the world's protected areas

    Protected areas

    The planet’s protected natural areas, on land and at sea, from the World Database on Protected Areas. Find out what is protected near you.

    • UNEP-WCMC (WDPA)
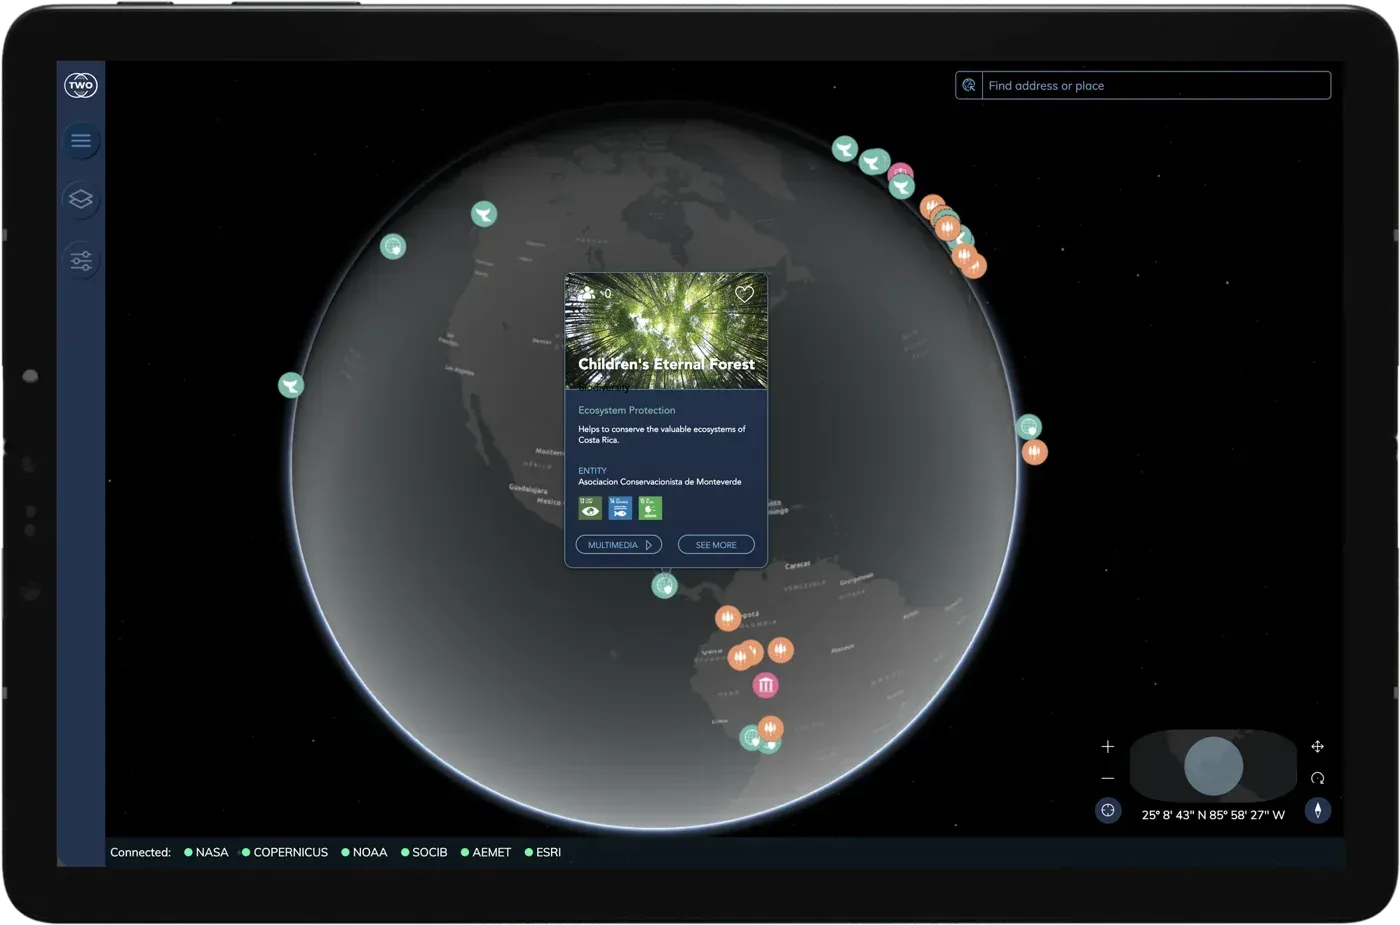
  • Atlas on a tablet showing nature restoration projects on the globe and the card for one in Costa Rica

    Projects

    Forests being replanted, seas recovering, species coming back. Nature restoration projects around the world, on the same map where you see what is at stake.

    • Nature restoration

Our sources

The Atlas organises information into layers: climate, atmosphere, land, biodiversity and sea. Each layer brings together data from scientific agencies and official bodies. We don’t produce that data: we bring it together, put it on the map and tell you where each data point comes from.
  • Ice sheets: NSIDC
  • Global temperature anomaly: NOAA
  • Land surface temperature: NASA (MODIS)
  • Soil moisture: Copernicus
  • Air quality: WAQI
  • CO₂ emissions: Global Carbon Atlas
  • Biodiversity: UNEP-WCMC
  • Threatened species: IUCN Red List
  • Weather: AEMET
  • Sea: SOCIB

Bespoke

Do you manage a piece of land?

However small it is, we can build its digital twin: a viewer with its soil, water, climate and risk data, and models that anticipate how it will change. With the same technology behind Atlas, tailored to your land.
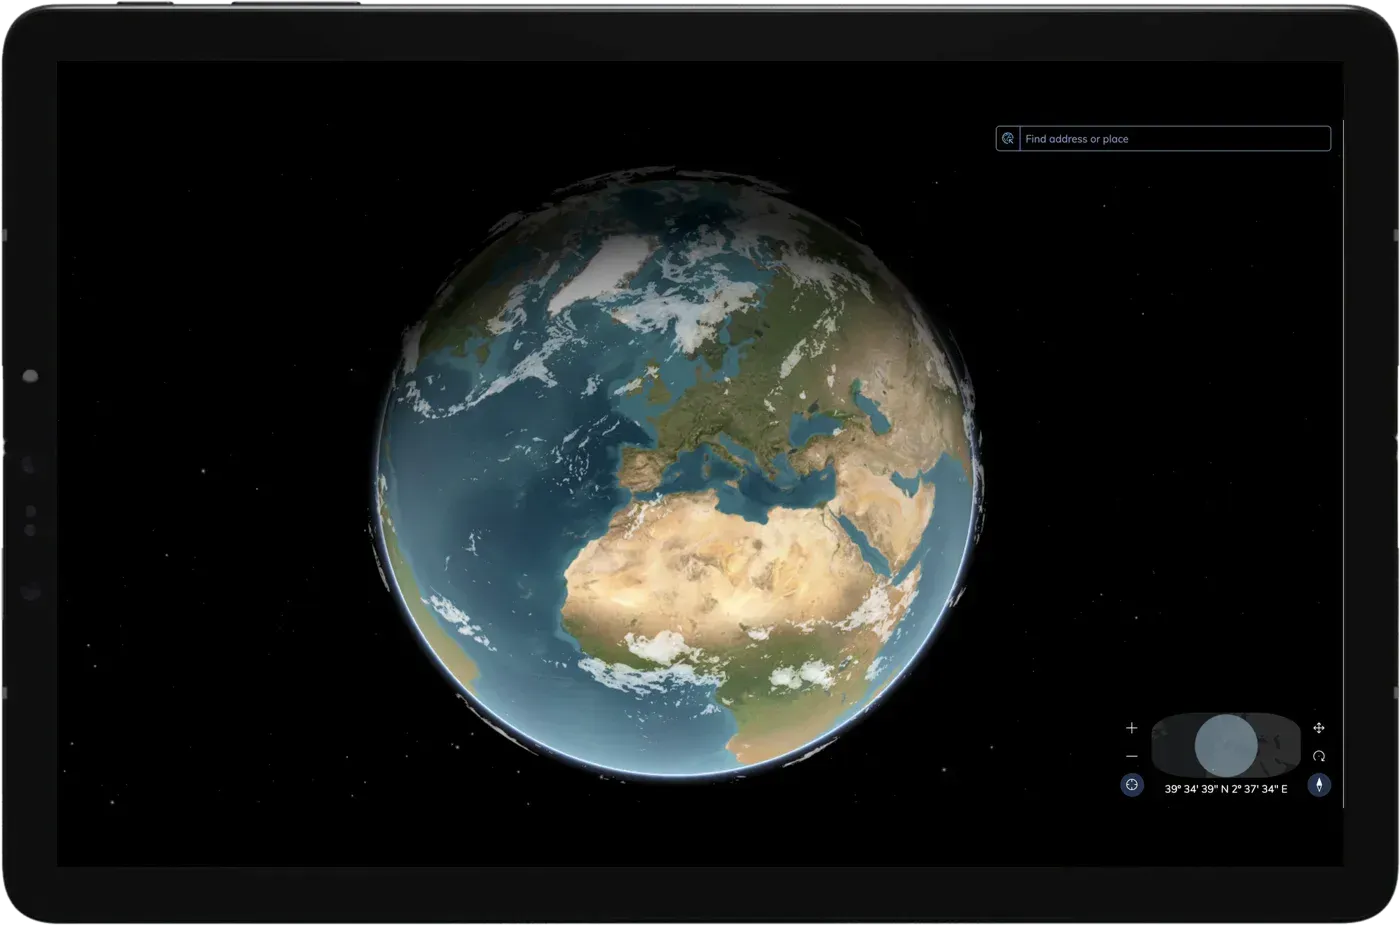
Atlas on a tablet showing the globe centred on Europe and Africa
Earth rotating, seen from space

Start exploring

Explore the planet layer by layer and see how it is changing.